

Publisher Central Reporting Tool
ROLE
UX Lead, Ebook Central
2019

TOOLS
Sketch
InVision
Principle
chart.js
Tableau

SKILLS
UX Research
Wireframing
Visual Design
Data Visualization
Prototyping
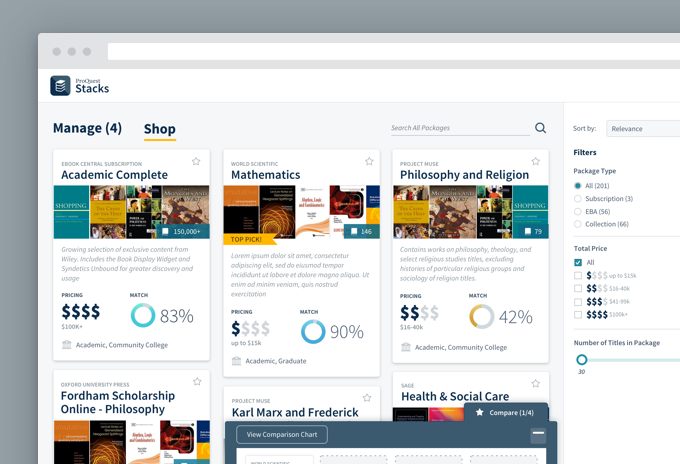
Several years ago, I acted as a Lead Designer during the initial creation of a publisher-facing reporting tool called Publisher Central. Earlier this year, the business identified a need to overhaul the existing tool to offer a singular authoritative source for sales data across an evolving landscape of sales channels. Additionally, a market-leading reporting tool could strengthen partnerships with publishers and introduce a new leverage point when negotiating partnership contracts in the future.
Much of my work focused on how publishers accessed and understood sales data from as many as 11 new sales channels. Most notably, the tool needed to add abilities for users to visualize and access sales data:
- that occurred within two additional customer-facing products
- for print books
- for purchases fulfilled through third-party vendors
Importantly, the product needed to seamlessly integrate these new channels into an existing experience which already supported 11 sales channels.
The team also explored ways that the tool could differentiate itself by offering unique and helpful trend-related insights.
Audience
This product focused on publishers who sell books throughout ProQuest’s network of products. Publishers could range from smaller niche house with infrequent sales up to large prominent publishers who continually manage and sell a substantial number of titles on a daily basis.
Individual users ranged from higher-level executives to mid-level staff who logged in on a regular basis to view and export reports. Most user goals centered around obtaining year-over-year sales trend data. Higher level executives generally expressed a need to quickly grab high-level sales summaries to assist with strategic planning. Mid-level employees needed much more robust tools to drill into and analyze specific trends.
The product discovery team primarily engaged with 5 publisher partners to gather feedback during the discovery and design processes. The size, type and location of these publisher partners ranged considerably in order to incorporate feedback from a representative sample.
Discovery & Design
The discovery team initially focused on identifying which features publishers regarded as essential and valuable. We asked them several questions to establish some benchmarks and identify the most fruitful paths forward:
- Understand the industry baseline to ensure our new reporting tool aligned with our competitors on a fundamental level
- Identify which potential differentiators mattered most to publishers
In addition to several group meeting, we met with all publisher partners individually in one hour testing sessions. We asked them about their experiences with other tools then asked them to participate in a card-sorting activity to better understand their priorities and expectations when it came to reporting.
During the card-sorting exercise, we asked the user to read through all the cards which outlined a wide assortment of features and improvement then place them in one of three categories:
- High Priority
- Users were asked to force rank features within this category after completing the initial sort
- Medium Priority
- Low Priority
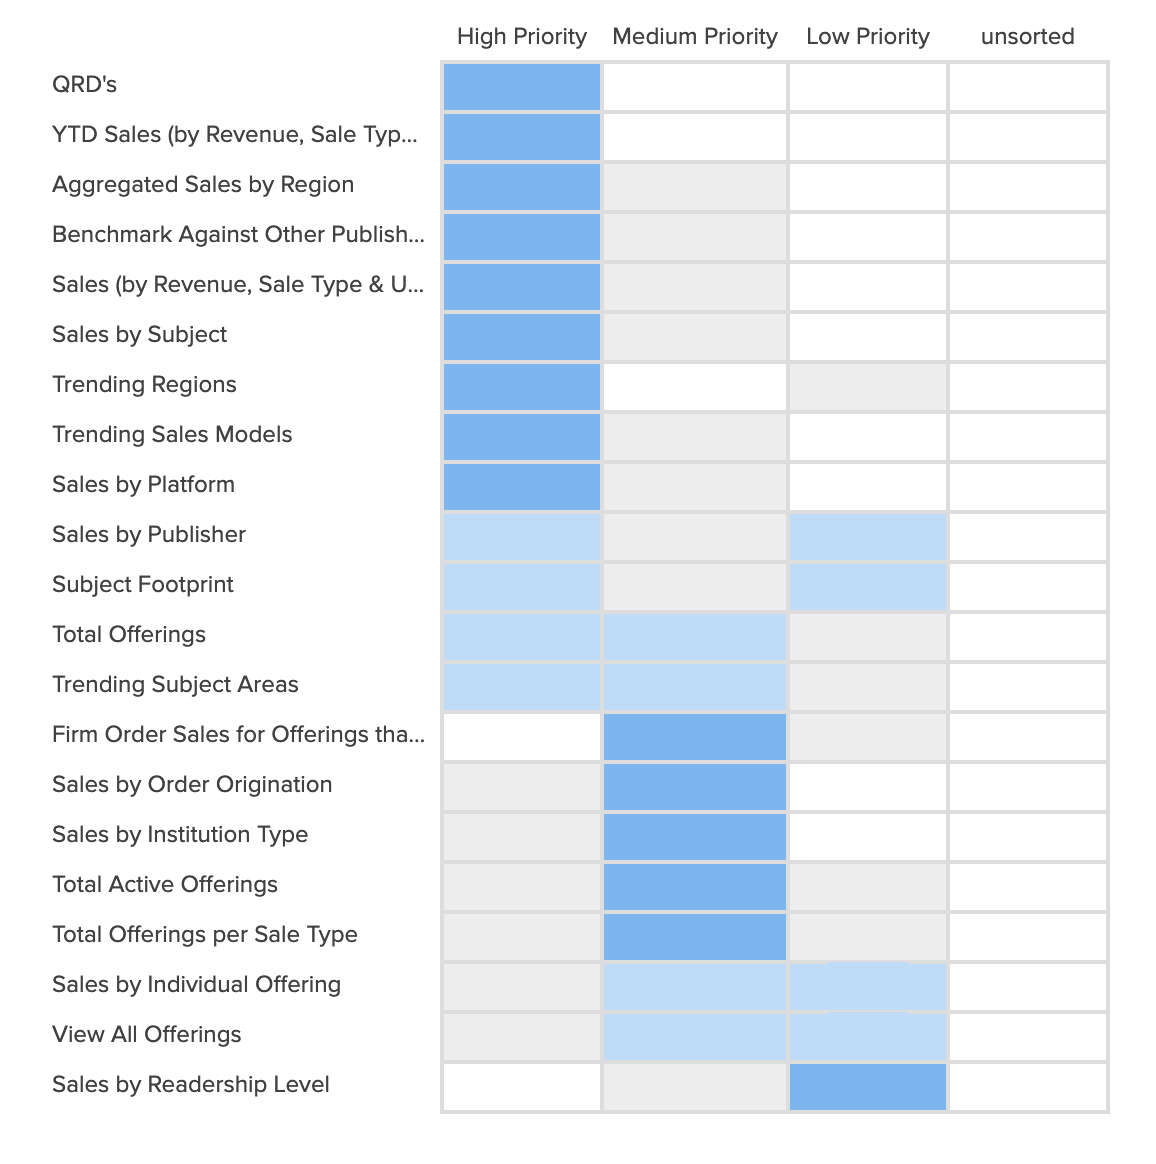
These conversations and exercises revealed some key insights:
- All publishers identified year-over-year statistics and QRD’s (a standardized quarterly report) as essential.
- Publishers had the strongest interest in trending regions and trending sales models.
- Most publishers expressed a desire to benchmark their pricing and sales against their peers.
- Several publishers seemed bewildered by the wide range of sales options and felt they often didn’t have a nuanced understanding of the relationships between sales options to make more targeted sales decisions.
The team also explored some unique and innovative ways to display sales metrics then asked users to rank them alongside more familiar reporting features.
These sessions gave us a better understanding of which features mattered most to publishers. We also felt we gained a much better understanding of publisher’s goals and needs when it came to reporting.
Iteration
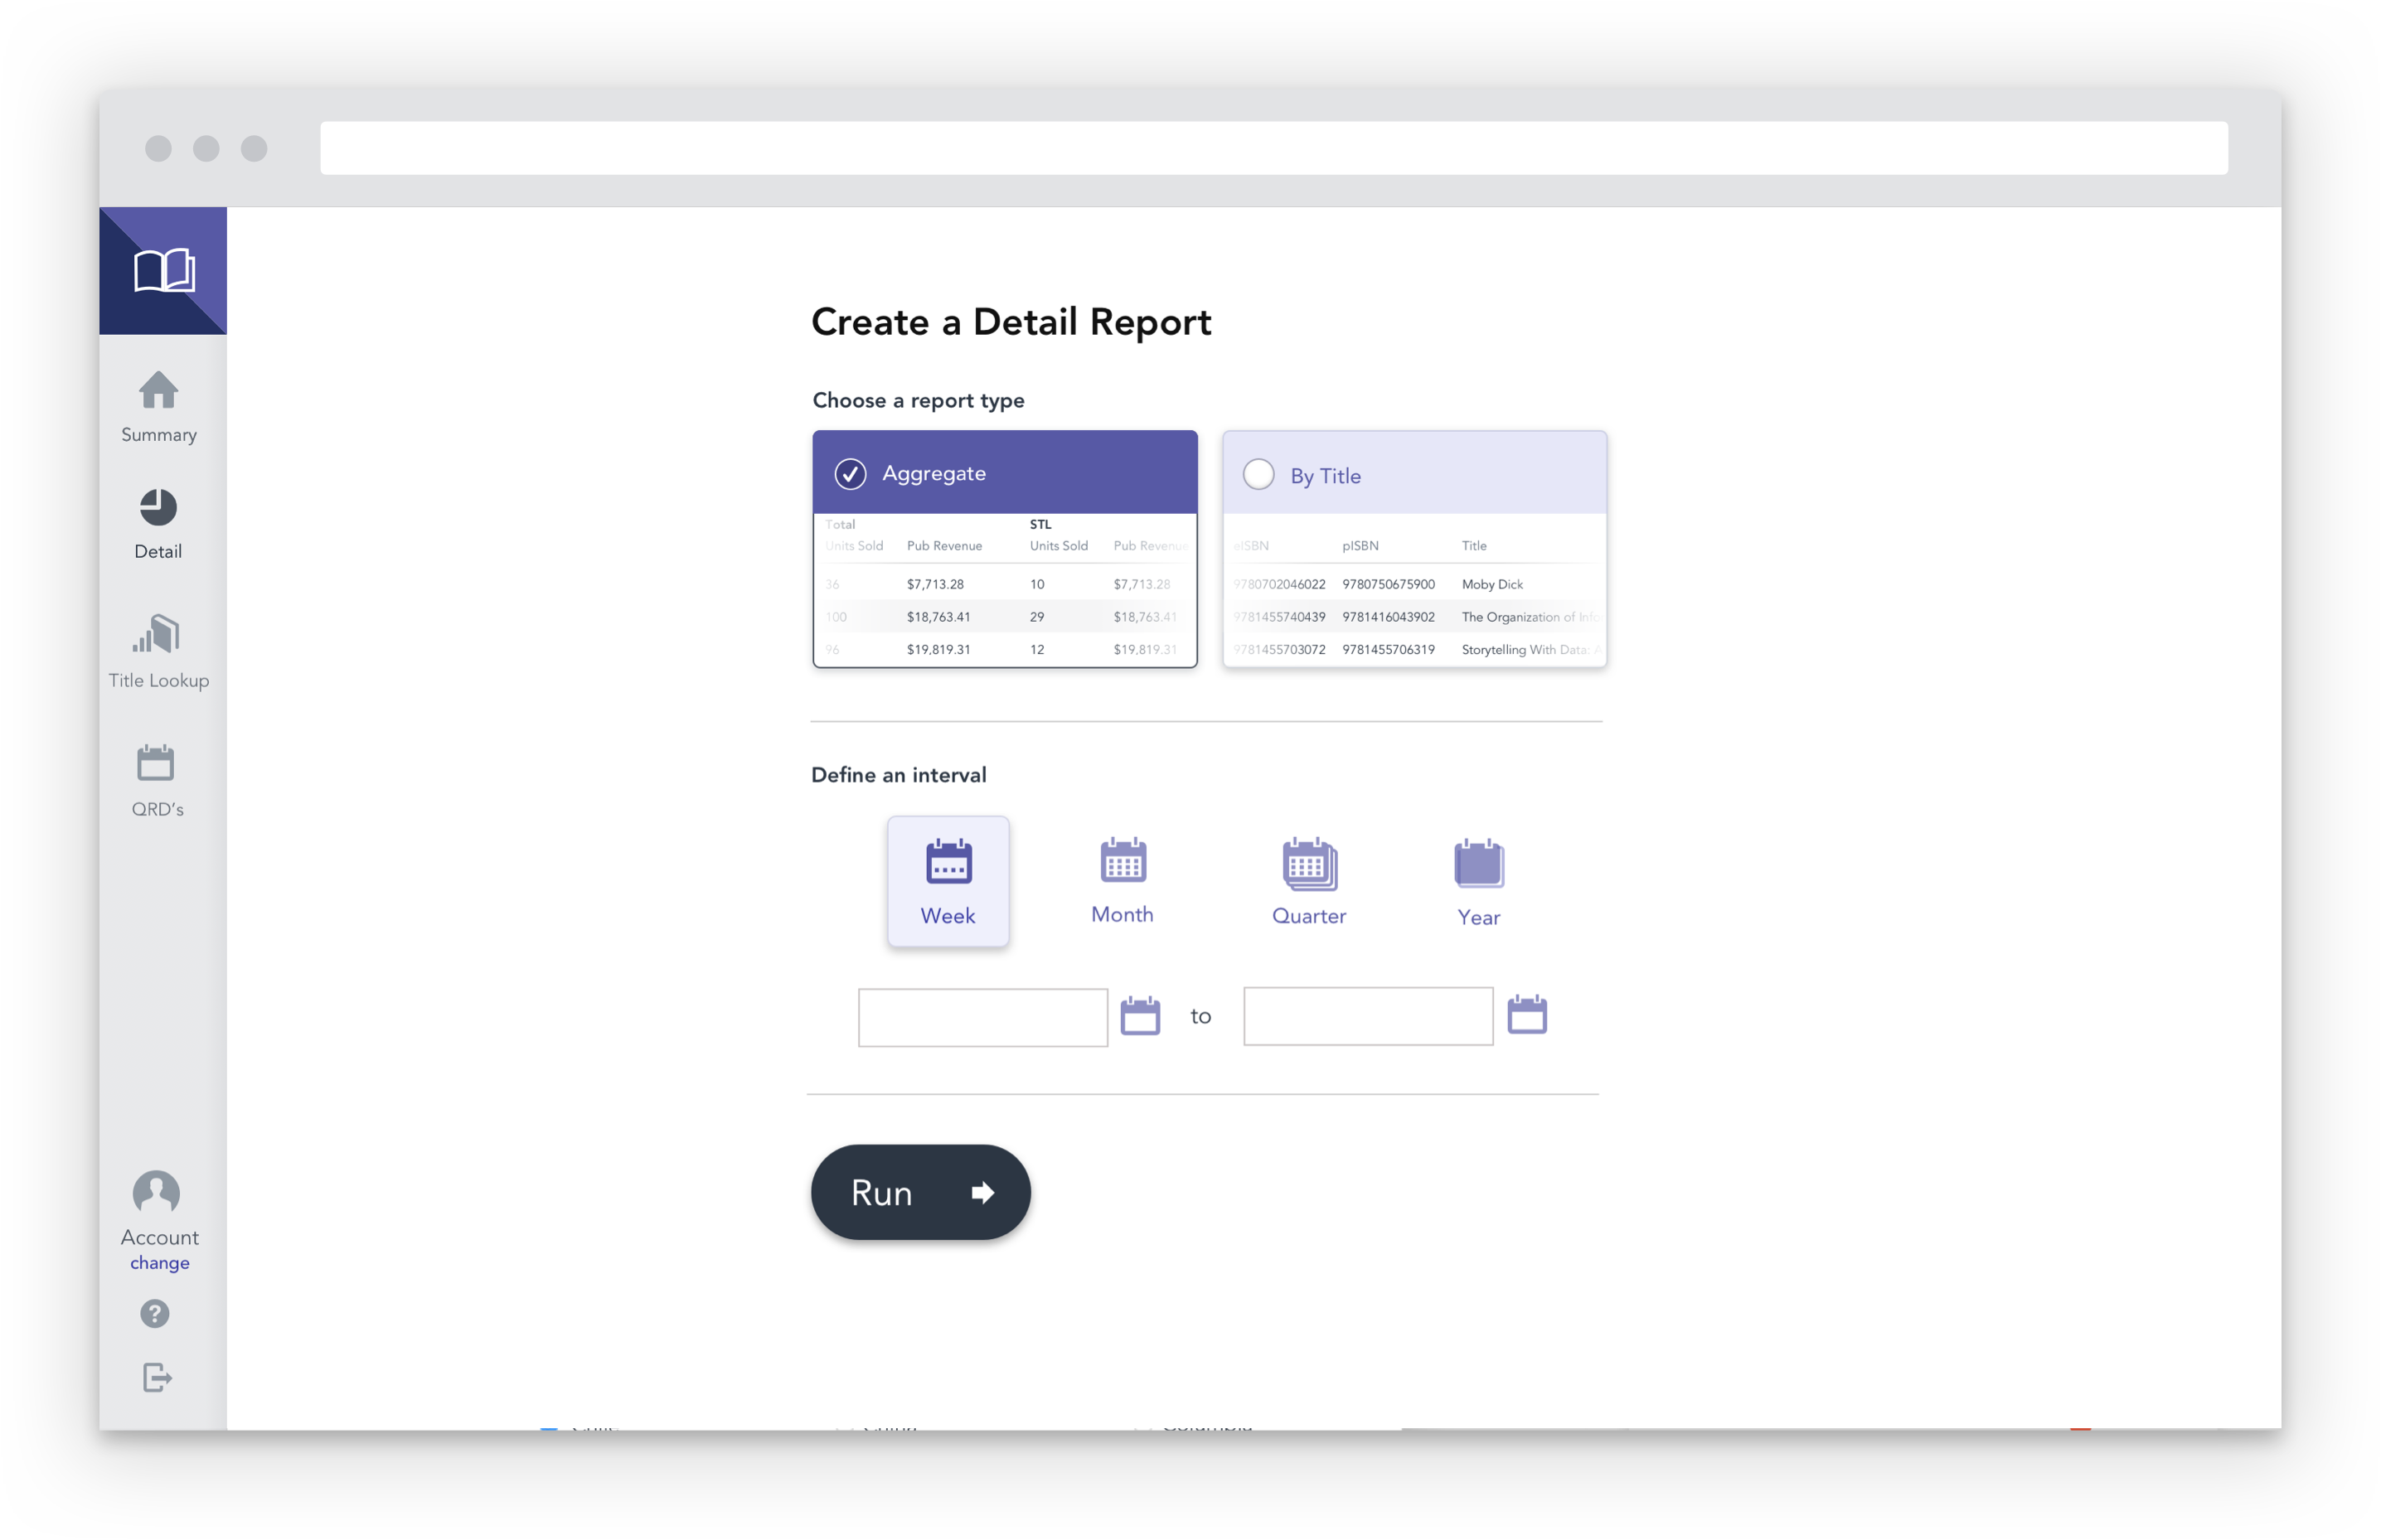
With a prioritized feature list, I then began exploring ways for publishers to access sales metrics in a more intuitive and helpful way. Accordingly, I created four distinctive sections of the tool to serve distinctive user goals:
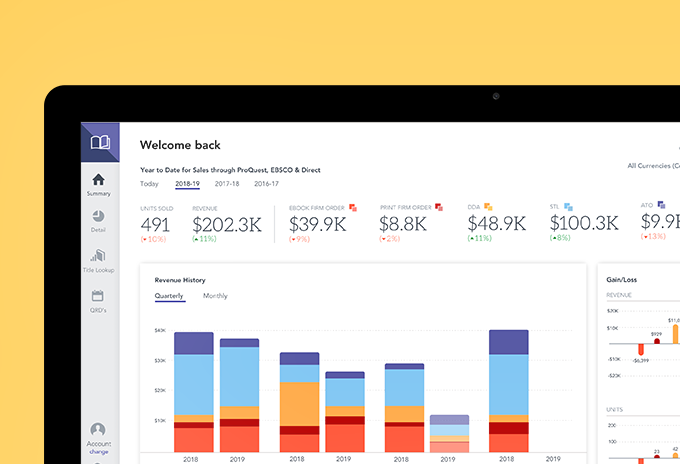
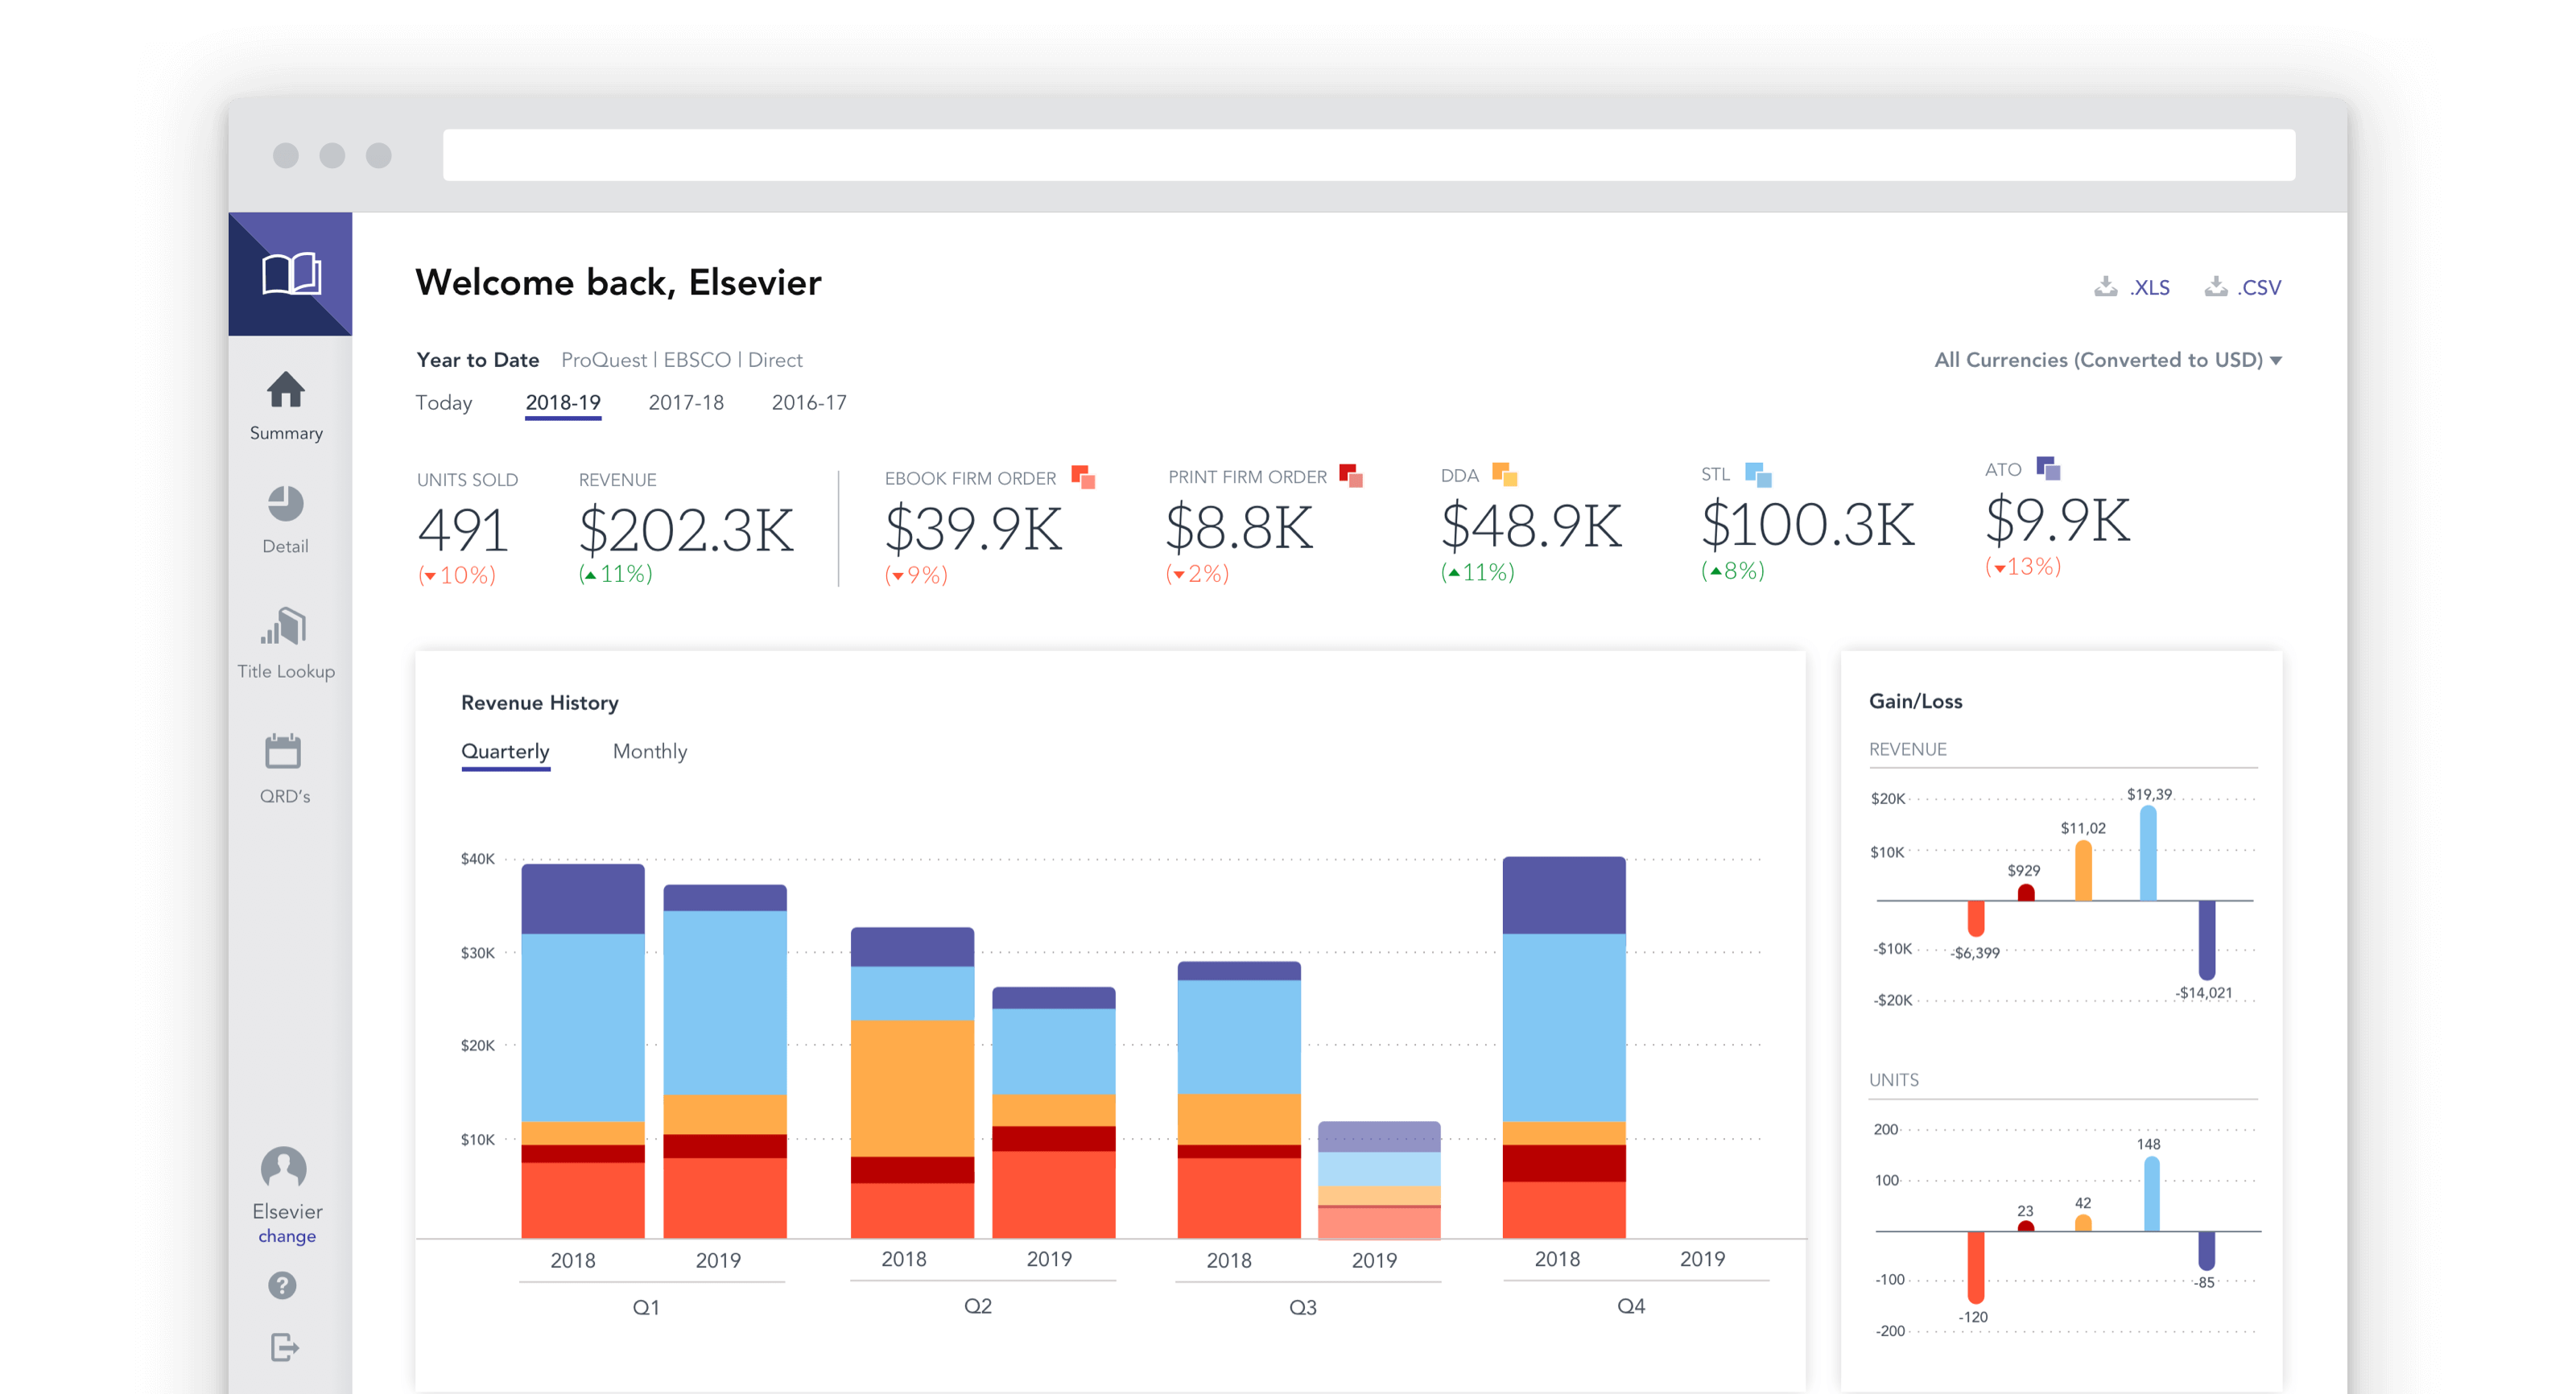
- Dashboard. An overview of historical sales hyper-focused on providing nuanced year-over-year insights.
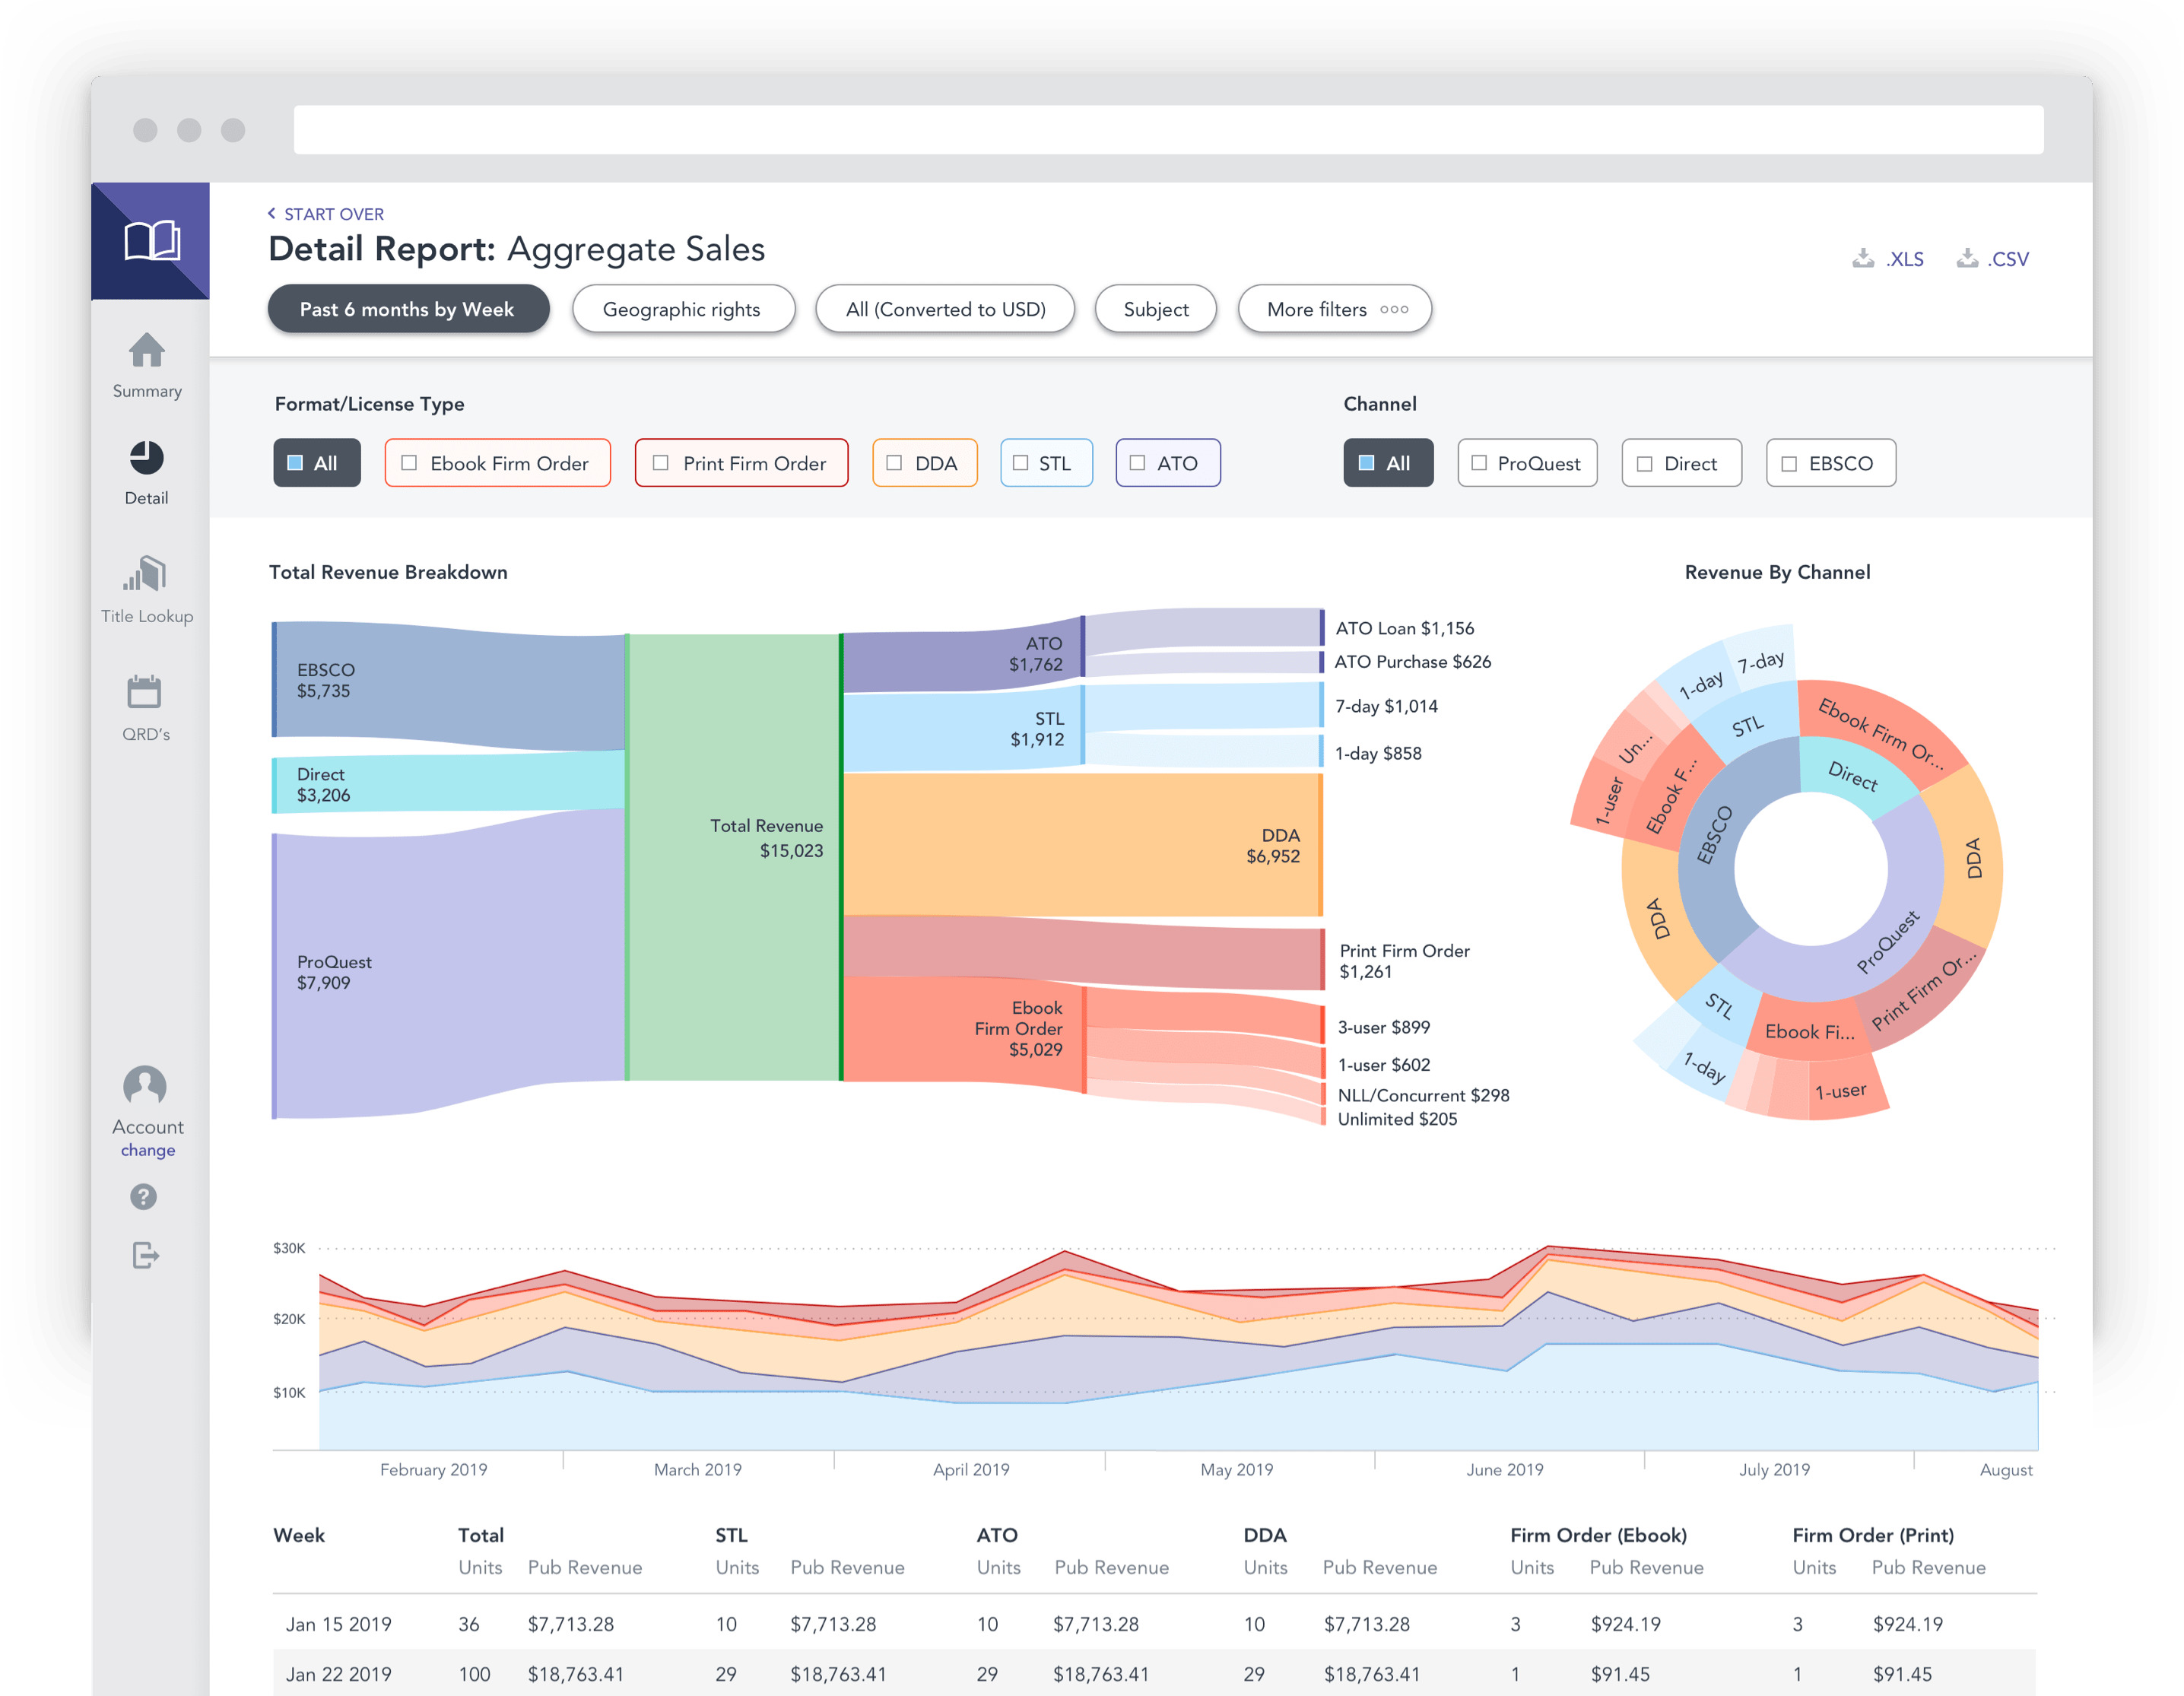
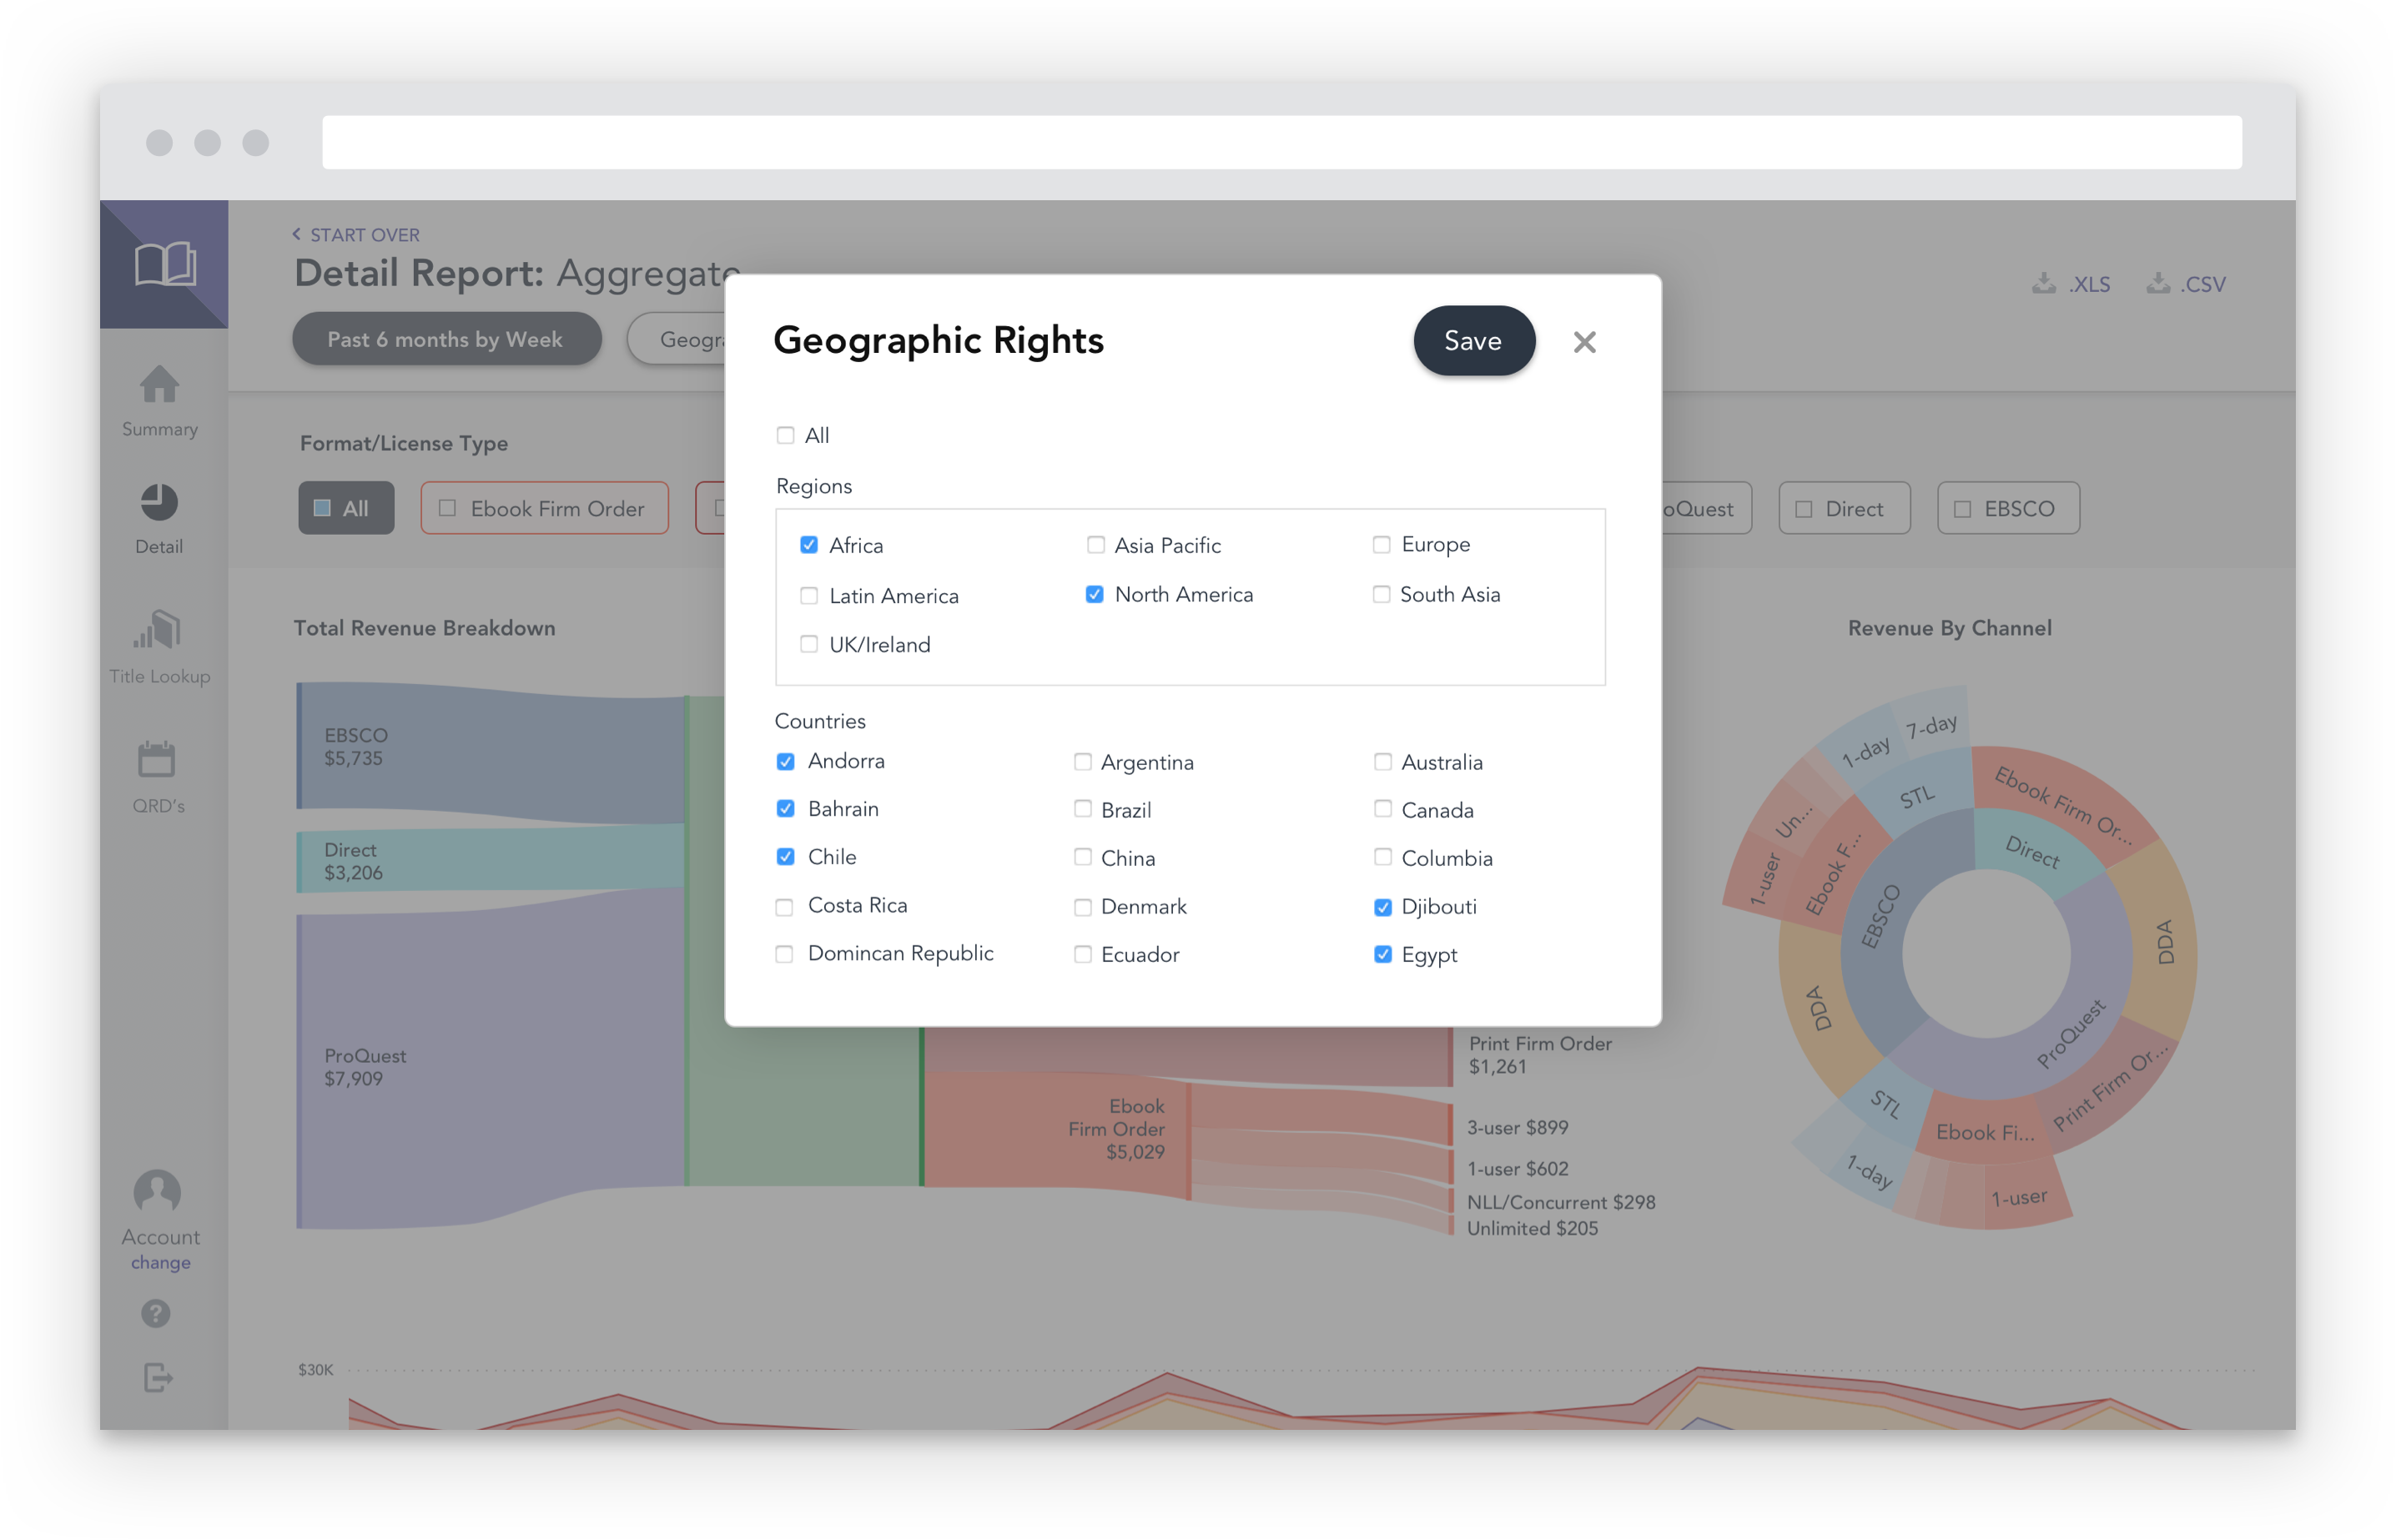
- Detail. A customizable report query which allowed the user to view sales by date range, region, subject area and other vertices.
- Title Lookup. A straightforward interface which grants the user access to the sales history of individual titles. Users had not ranked this feature highly during discovery but the team felt that mid-level employees at publisher houses might express more interest in a feature like this.
- QRD’s. A portal to download standardized quarterly sales reports. Publishers identified these as essential because they could be combined with reports from other aggregators.
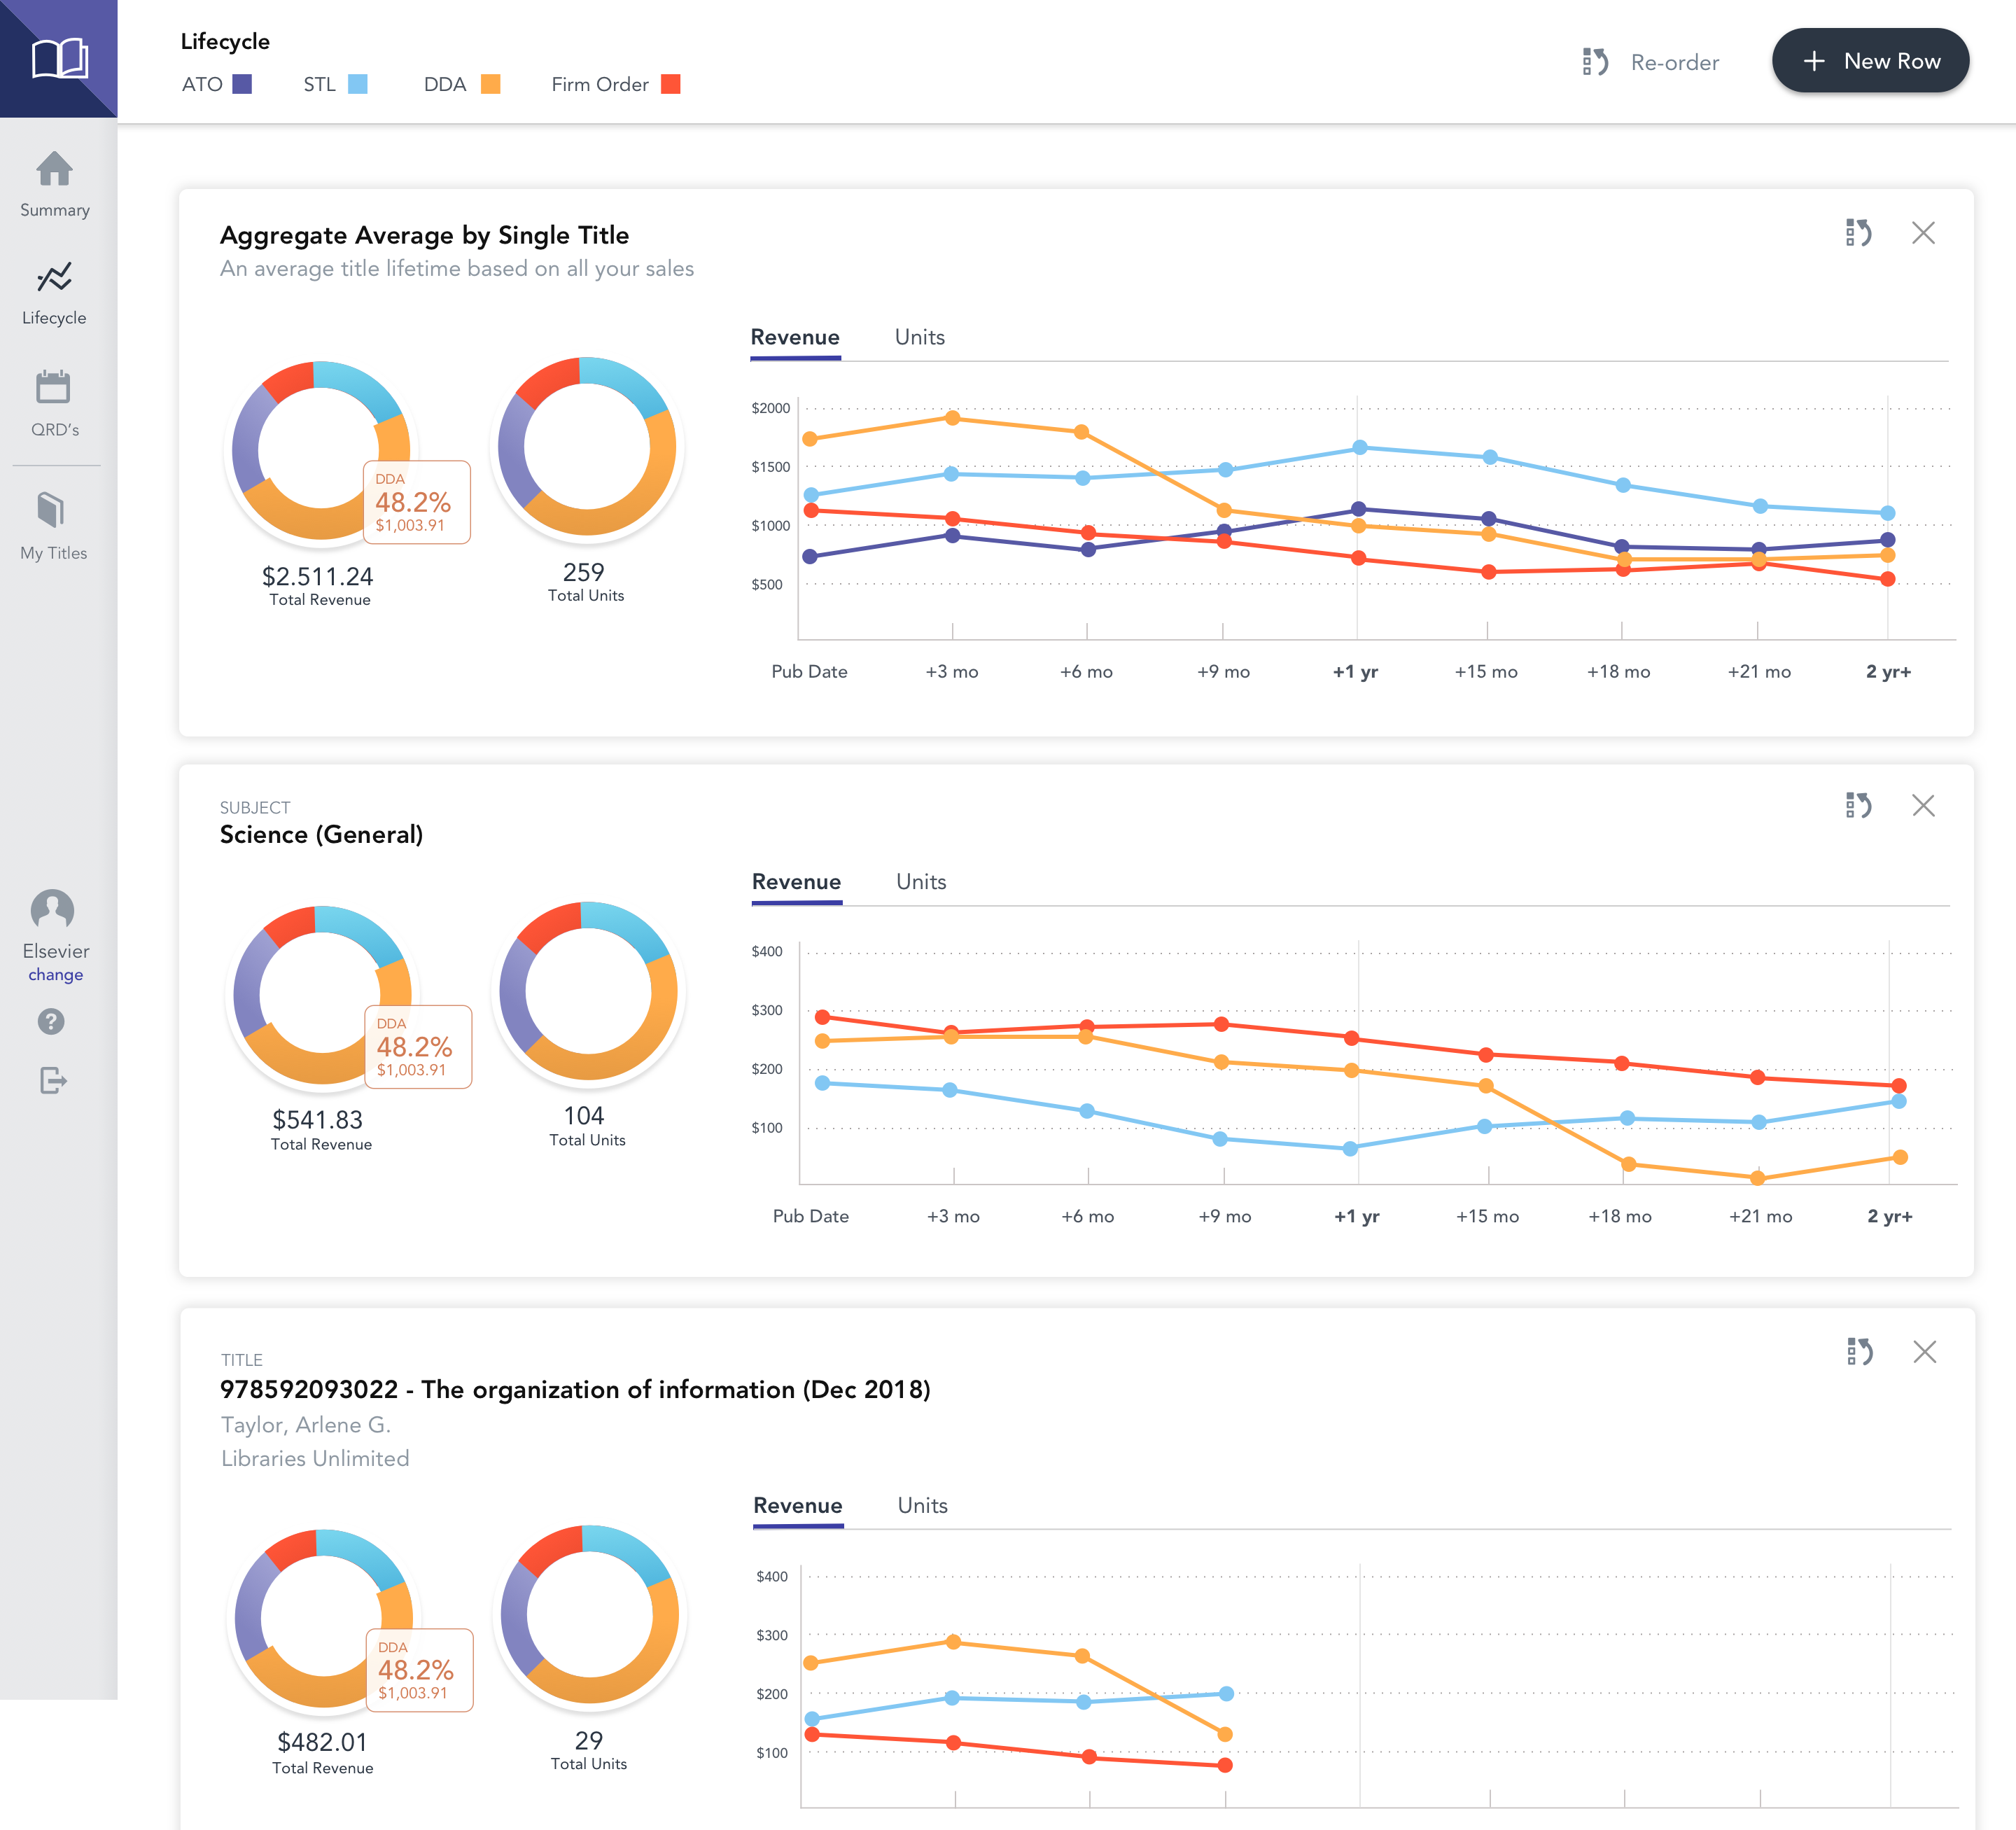
Because the Dashboard and Detail experiences needed to accommodate the widest range of user goals and express the most statistical insights, I spent most of my time focusing on these two pages.
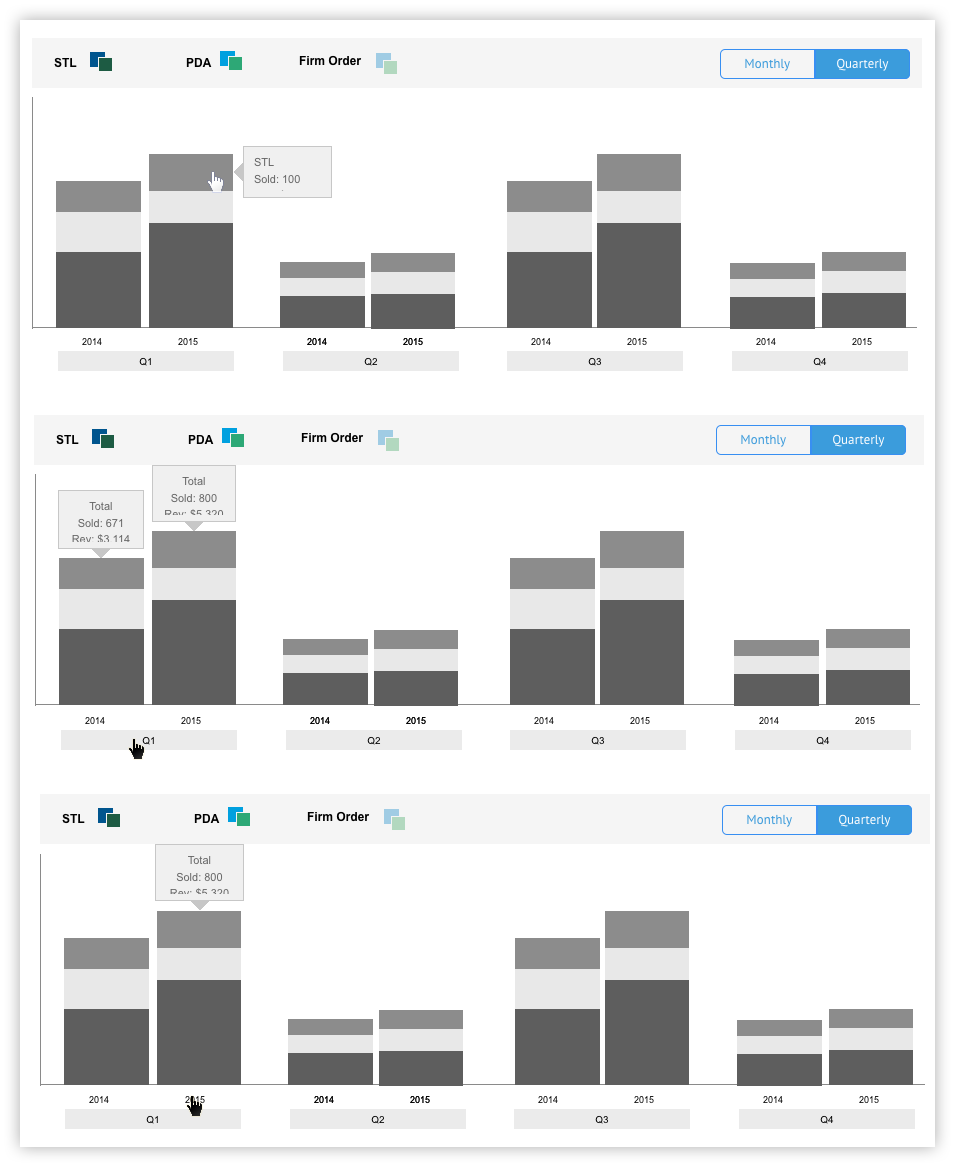
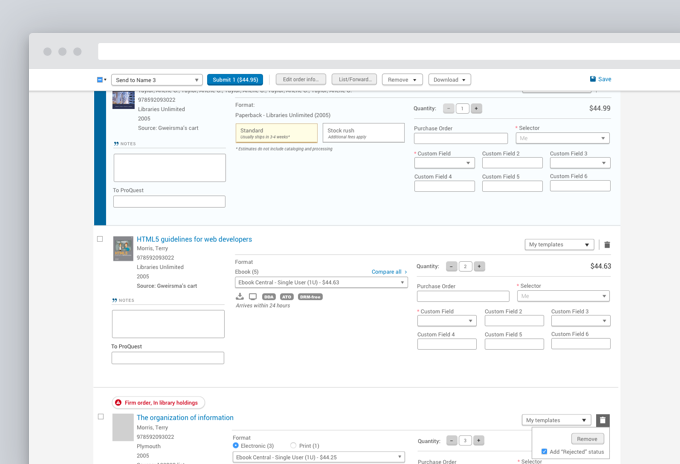
I initially collected most the feedback from our partners via a private message board. This approach allowed me to rapidly iterate in real-time as feedback got posted to the board. The most spirited discussions with publishers centered around the visualization of detail report sales data. Because a single title could get sold via 22 different channels across our platforms, we explored a wide range of paths and options together.
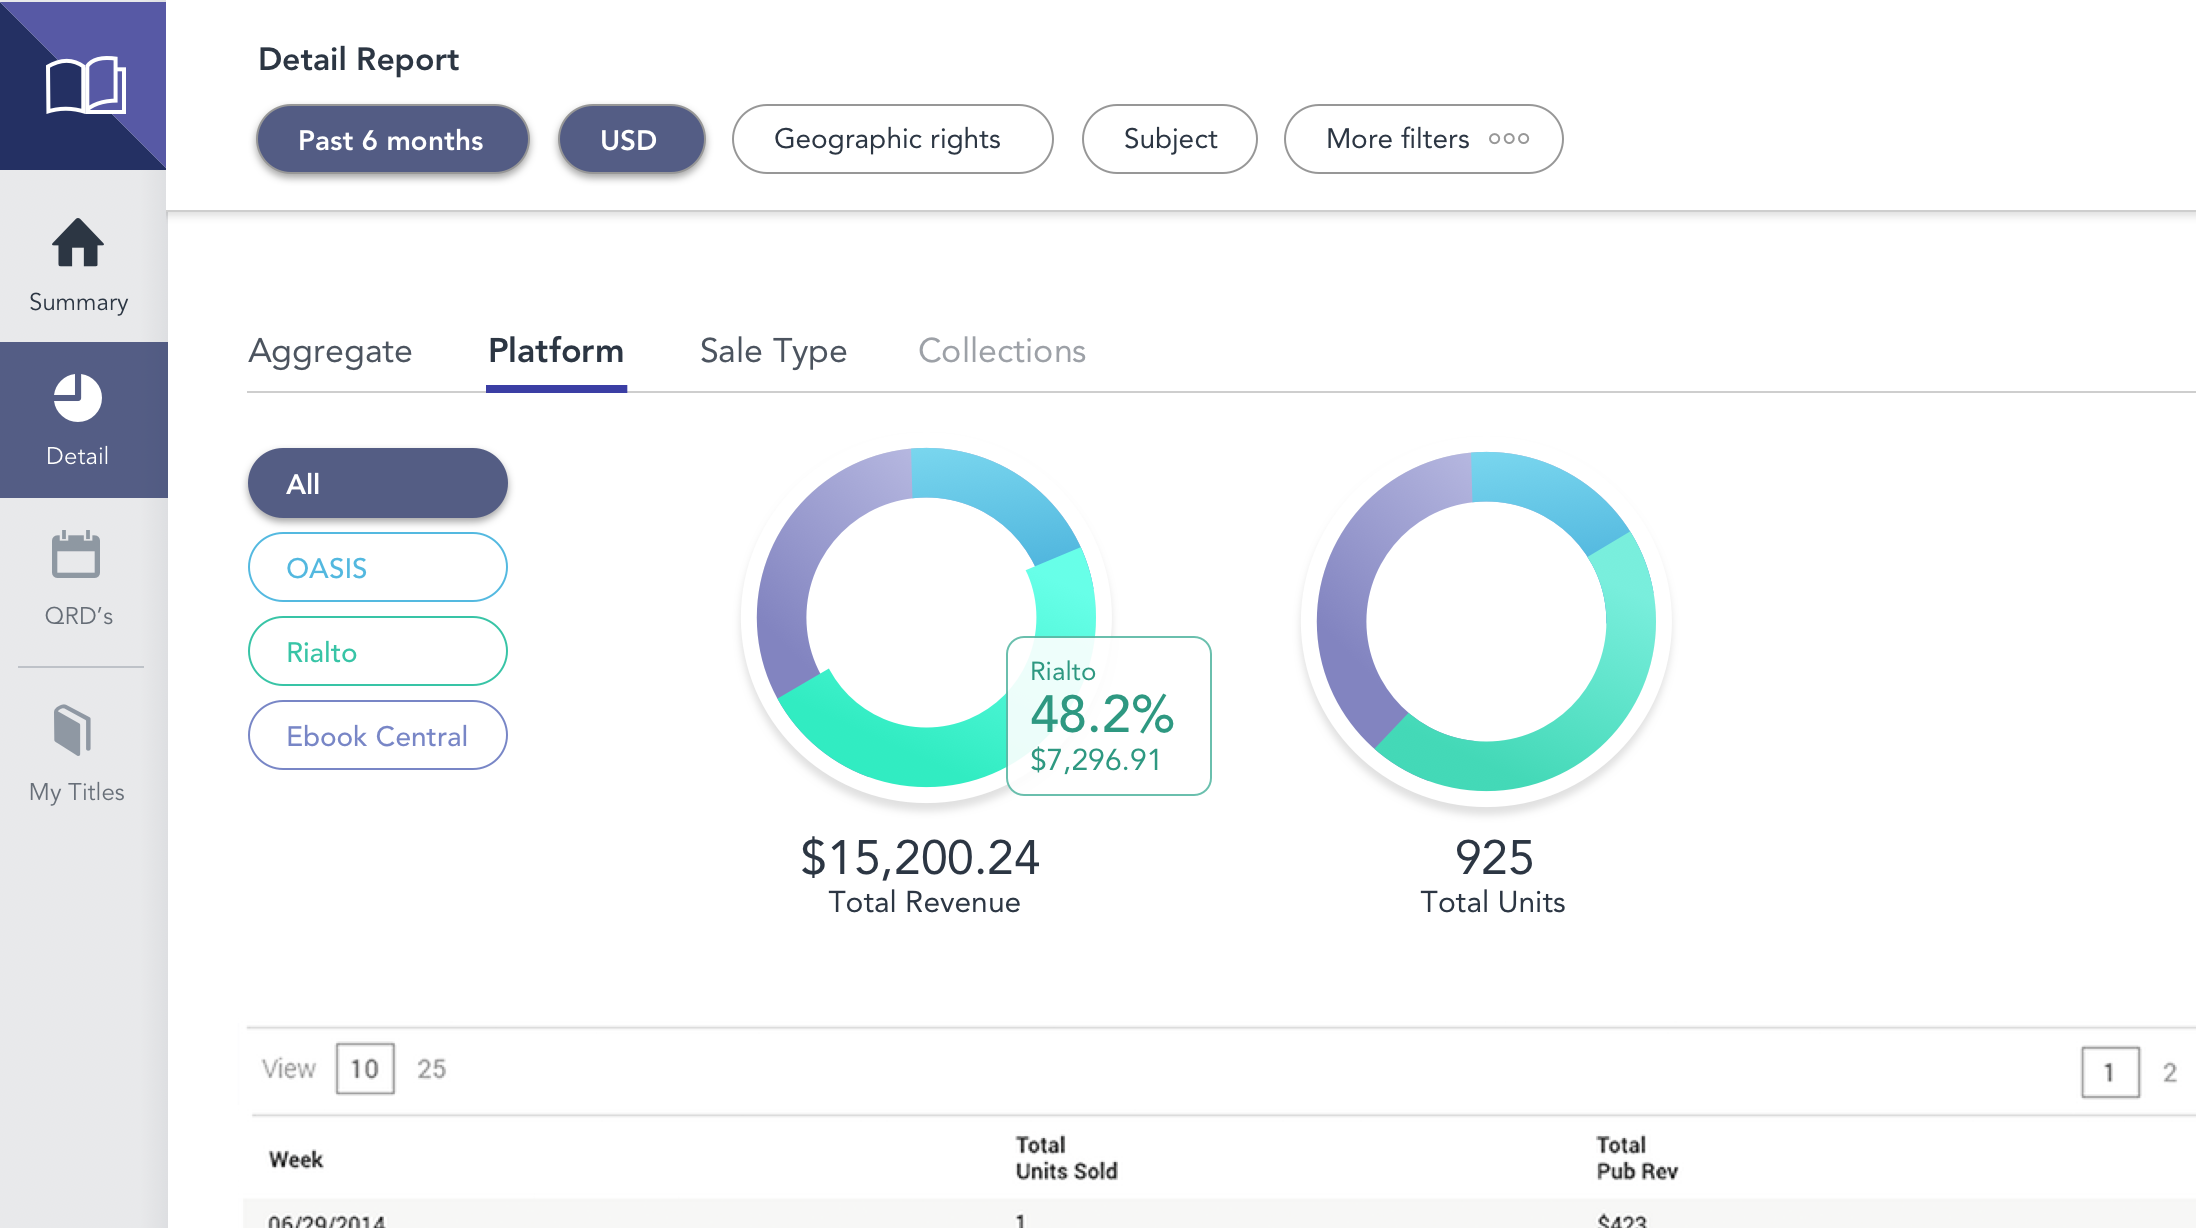
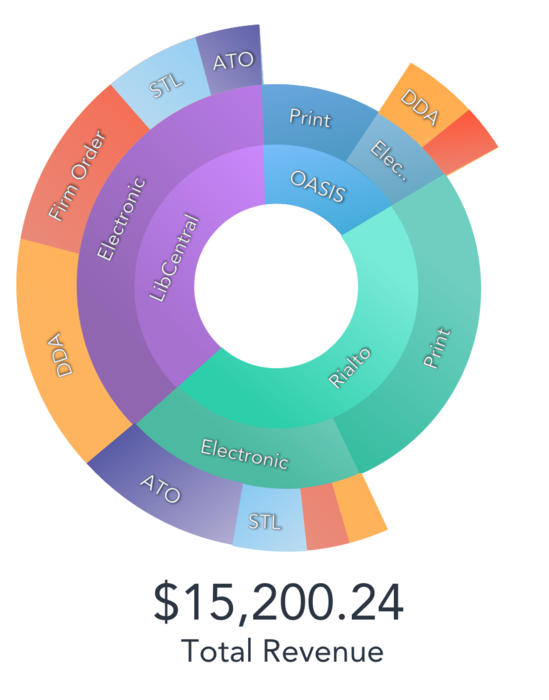
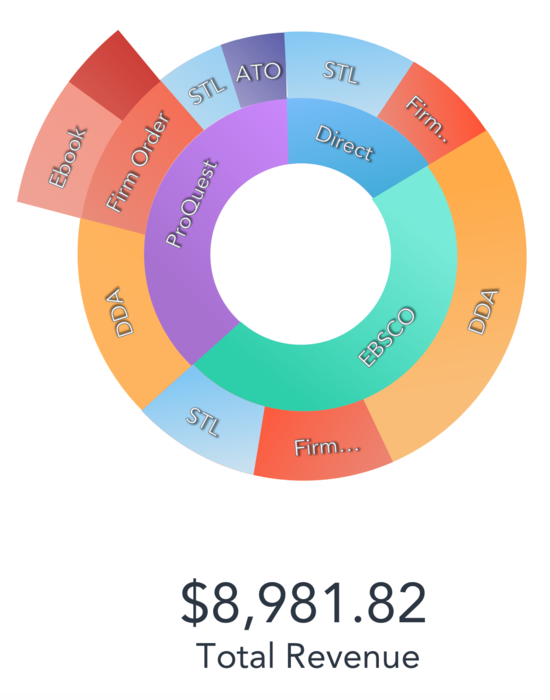
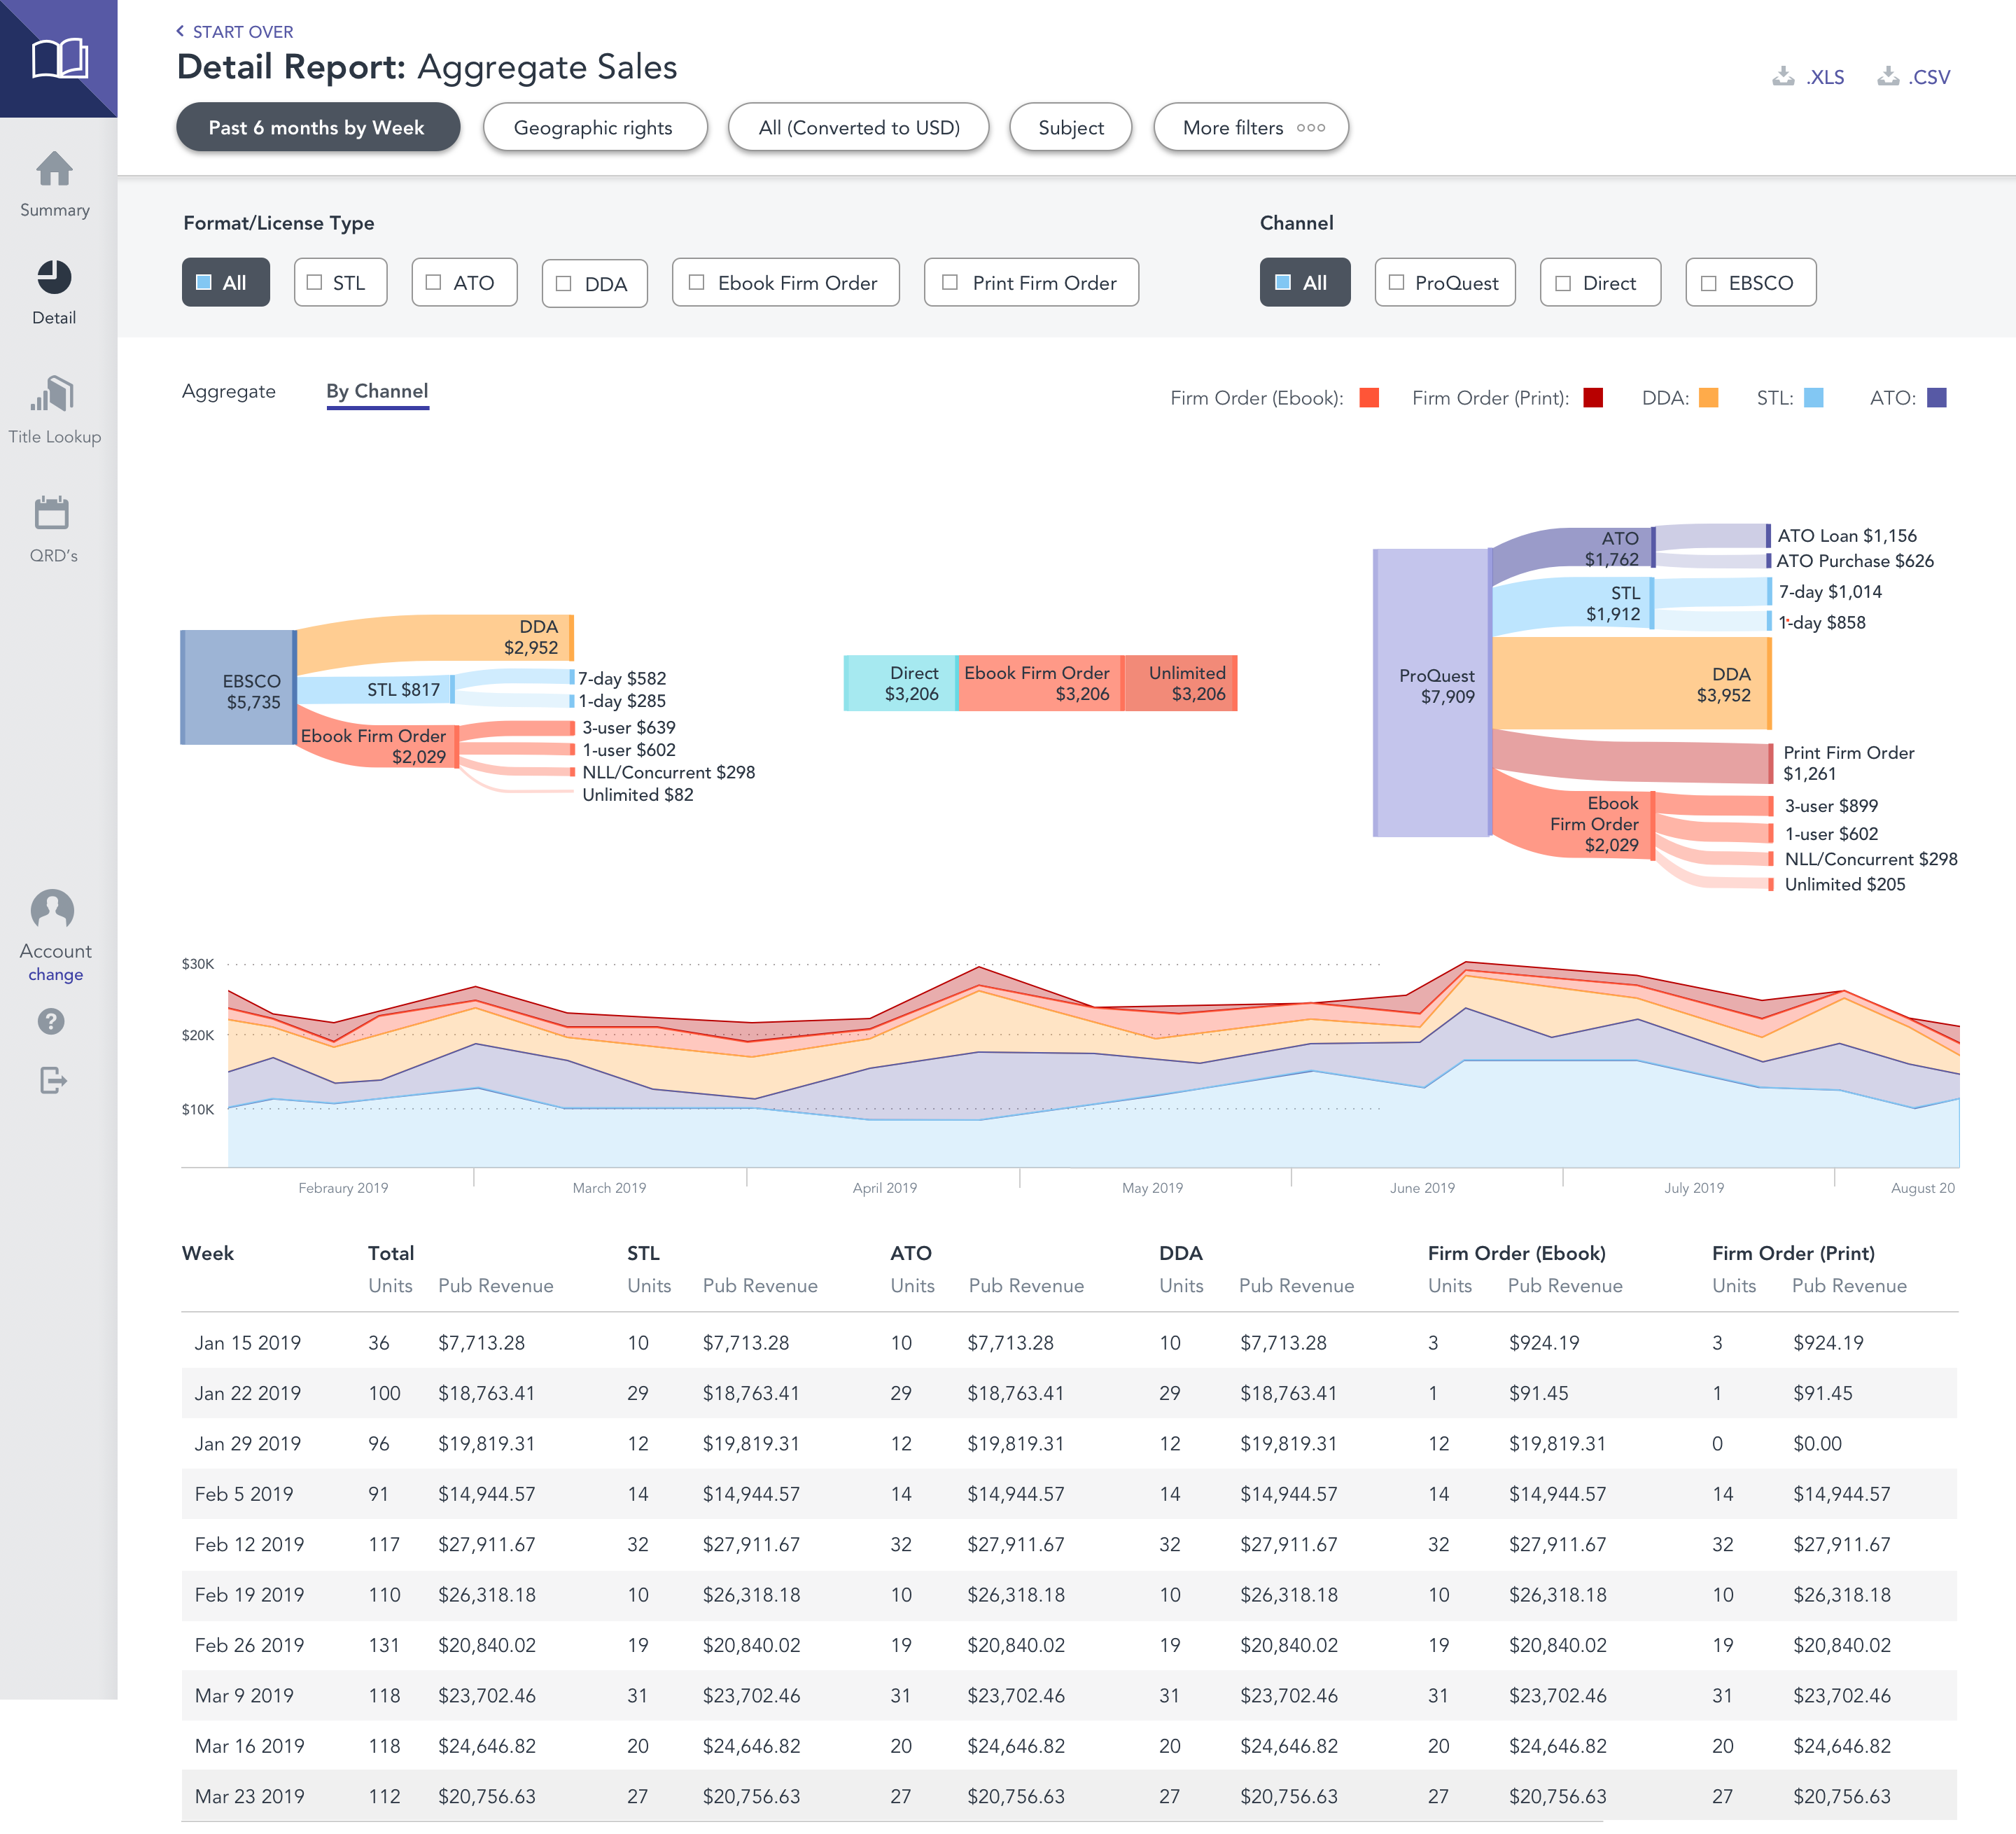
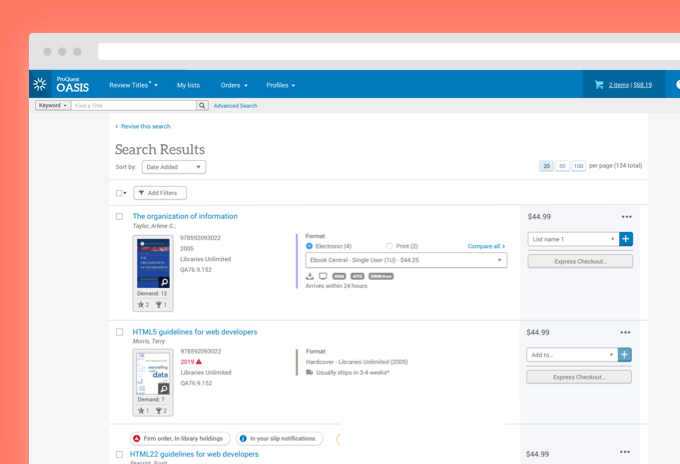
One surprising (and welcomed) finding was that publishers did not care to distinguish between the three separate products librarians used to purchase their titles. Rather, they preferred to roll up these three sources into one broader channel: ProQuest. Much simpler! Additionally, we spent a lot of time weighing various visualizations of their sales data. Eventually, the group settled on a Sankey diagram coupled with a Sunburst treatment to express their detailed sales query.
Solution
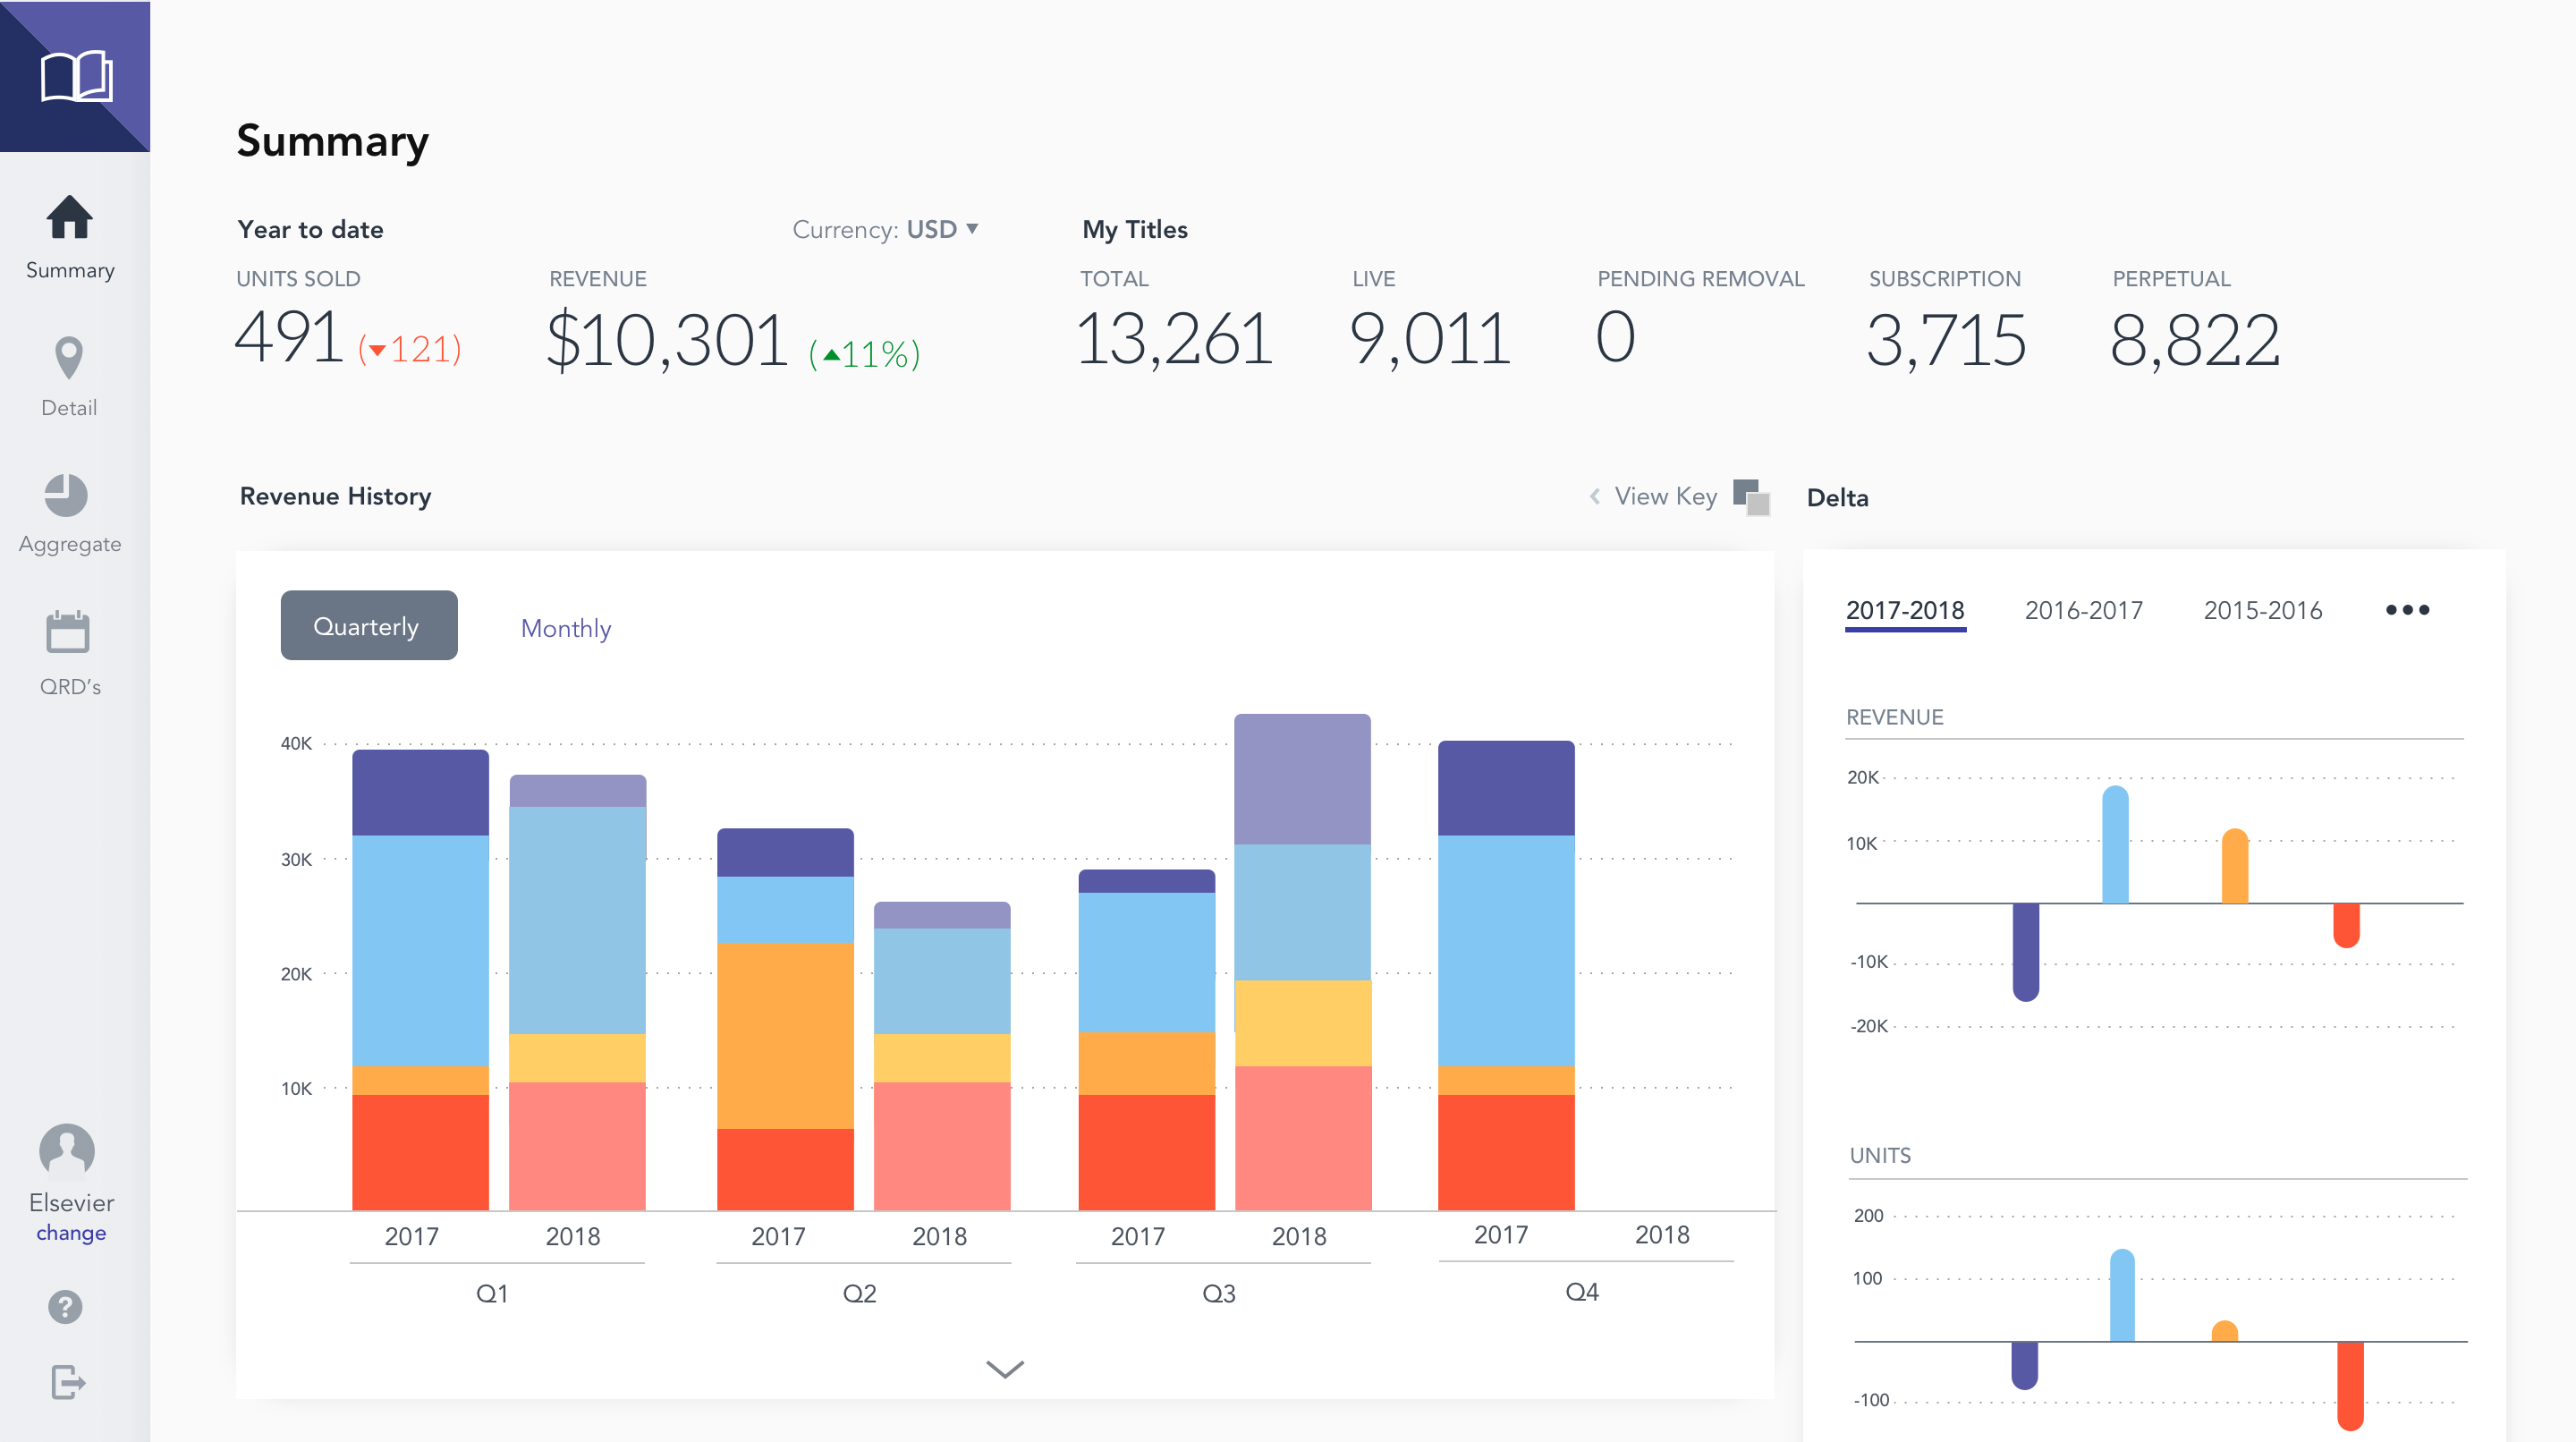
After several testing and feedback cycles, the team honed in on effective and essential reporting functionality. A dashboard page featured an overview of sales paired with an ability to drill into specific year-over-year comparison metrics. Specifically, I added the abilities to:
- View year-over-year sales data across multiple years
- Better visualizations of changes between years
- Access more specific year-over-year data for an individual quarter or month

What I Learned
- Sophisticated and innovative data insights cannot solve every pain point. While I found it personally rewarding to distill extremely complex networks of sales data into easily understandable visualizations, it became evident that the publishers themselves couldn’t always translate advanced nuanced insights into better business decisions. It quickly became clear that the expansive and interconnected network of sales channels we offered created a lot of confusion and indecisiveness within our publisher partners. As a result, we focused the tools on offering actionable and relevant insights which would also nudge them towards a deeper understanding of their own business and sales strategies.
- Get feedback from users early and often. This is not so new to me but rather a reiteration of a philosophy I already follow. Early in the process, I had assumed publishers would want to view sales for each end user product. I spent a brief time creating a mockup which depicted these complex relationships. However, when I showed this rough interface to publishers, they quickly dismissed this approach and instead offered a much more straightforward solution which grouped the three products under one umbrella. This early feedback led to a better use of my time and ultimately a more effective solution.